INNER-INVESTOR OUTLOOK FEBRUARY 2014
US EQUITIES OUTLOOK:
After a phenomenal 2013, the first month of 2014 started off quietly and ended violently badly for the major U.S. equity indexes. The economic data following the holiday season appeared to be strong, but as earnings season approached, concerns mounted about future corporate earnings.
As economic data was released and earnings reports were announced, the price action in the equity markets was largely choppy. For most of the month, the S&P 500 Index (SPX) traded in a tight range between roughly 1,815 and 1,851.
The most significant economic news item in the United States was the reduction of the Quantitative Easing Program by the Federal Reserve. Less than three months ago the Federal Reserve was injecting more than $85 billion dollars/month into the economic system through its purchase of primarily longer-dated Treasury bonds.
However, after tapering purchases in December by $10 billion dollars, the Federal Reserve further tapered by $10 billion dollars in January. February will see asset purchases reduced to $65 billion dollars, a more than 20% reduction in the flow of freshly printed money.
At first, this news didn’t disrupt U.S. capital markets. However, as it started to sink in, a major problem in the emerging market economies and their financial systems became clear late in the month.
Currency issues in Latin American primarily started to cause dislocations in the fx markets with Argentina leading the way towards a major currency crisis. Venezuela followed. Suddenly a large number of emerging market countries started seeing trouble with their currencies and the ability to finance their debt. Money moved out of emerging market debt instruments
In the last week of January, the key 1,815 level broke on the S&P 500 Index as the emerging market issues started to leak into major markets such as the Japanese Nikkei Index. The correlation between the U.S. equity markets and the USD/JPY currency pair was notable. The Nikkei and the Japanese Yen plunged with the U.S. equity markets following suit.
The S&P 500 Index (SPX) closed at around 1,782.50 at the end of January, having dropped nearly 4% from the closing highs in 2013. Equity indexes were battered down while the U.S. Dollar Index futures rallied to the best levels since November of 2013. Gold prices moved higher while silver futures demonstrated relative weakness compared to gold.
The energy markets were wild as oil futures pushed higher most of January. The biggest winner in percentage terms across all asset classes was natural gas futures. Natural gas moved higher due to unusually cold winter weather across a large portion of the country driving energy demand considerably higher.
U.S. Treasury’s also saw strong buyers stepping in late in January as money was moving out of risk assets and back into the safety of government obligations. The best performing equity component of the U.S. markets were the gold miners. The worst performing sector insurance.
Overall, the economic data and earnings were mixed. There has been strong selling pressure in January in U.S. equities as future earnings growth concerns paired with poor weather has negatively impacted the business climate around the world. While 2013 was a very strong year for equities, 2014 has gotten off to a poor start.
As the Federal Reserve continues to scale back its asset purchase program, and earnings growth remains mixed, concerns of an emerging markets debt / currency crisis will likely keep volatility high in February.
US EQUITIES TECHNICAL ANALYSIS:
Rather than trying to predict the unpredictable, it’s important to understand the basics of investing and the AlgoTrades philosophy.
How to be a successful investor:
1. Follow the market’s trend and trade with it. There is a natural tendency for humans to be bearish in a raging bull market and to be bullish during bear markets.
Everyone wants to be a hero by picking the top or bottom while making a fortune at the same time. Unfortunately investing success does not happen that way unless you get really lucky.
Instead, we follow the intermediate trend which we will show you in each month’s issue using our INNER-Investors Analysis.
2. Do not trade or invest based on forecasts. Our BIG PICTURE analysis shows you what is possible on both sides of the spectrum (bullish and bearish). Knowing what could happen is a mental thermostat to help you keep your cool when things get volatile.
3. Understand that when a market reverses direction your last trade will likely be a losing trade. Why? Because we trade with the trend. Losing on some positions is a part of investing.
While our system is geared towards reducing risk, it is impossible to predict the future.
The analysis in this newsletter helps calm your nerves and allows you to ride trends longer. Knowing what the current trend is will prevent you from second guessing your positions. The information we offer is a tool for making money and strengthening self-discipline.
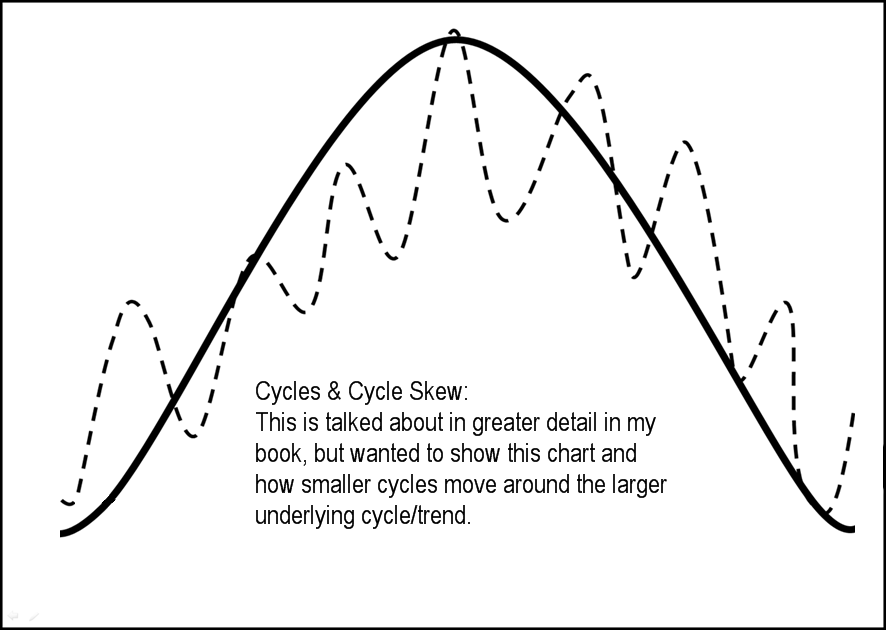
Simple Visual of Trends, Cycles and Cycle Skew
The stock market moves in wave like patterns and through the use of INNER-Market Analysis we can identify and plot the active and current cycles moving the market.
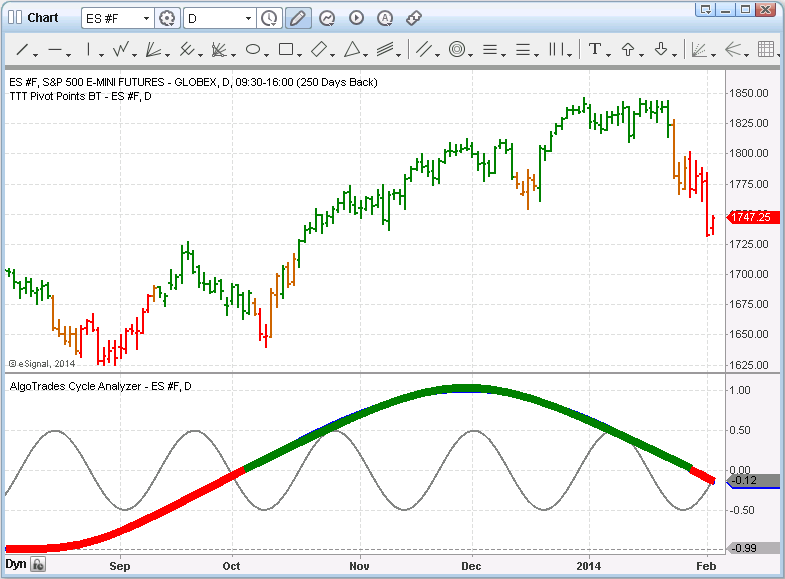
AlgoTrades Cycle and Trend Analysis
The daily chart of the SP500 index below shows our current cycle and trend analysis. I color coded the intermediate trend cycle (largest cycle). During the green portion of the cycle we can expect prices to have an upward bias.
Based on the cycles below, I expect the next couple months to be volatile with choppy price action. It looks as though the market is about to start a major topping phase but until we get more price, volume and sentiment analysis, we can only follow and trade this new down trend.
Once a new trend in the market starts, the previous cycle analysis gets tossed out the window. New cycles are calculated within a few days of the trend reversal. Because stocks rise slower than they fall, we cannot use a sine wave as shown in the chart below for timing or trading. Cycles should be looked at as a quick snapshot of the market for an idea of the price bias (up, down or mixed). Once we know the bias we can focus on standard technical analysis and position strategies for trading.
 Algorithmic Trading Strategies
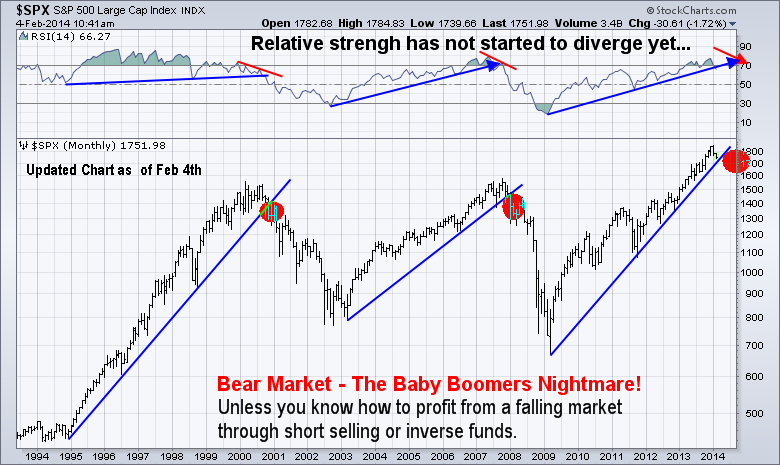
S&P 500 Monthly Index Chart
Here is an updated chart (from last months issue) showing how price is nearing key support trend line.
This chart falls in line with our cycle analysis. We are likely to have a multi month topping phase which would start the next bear market if this trend line is breached.
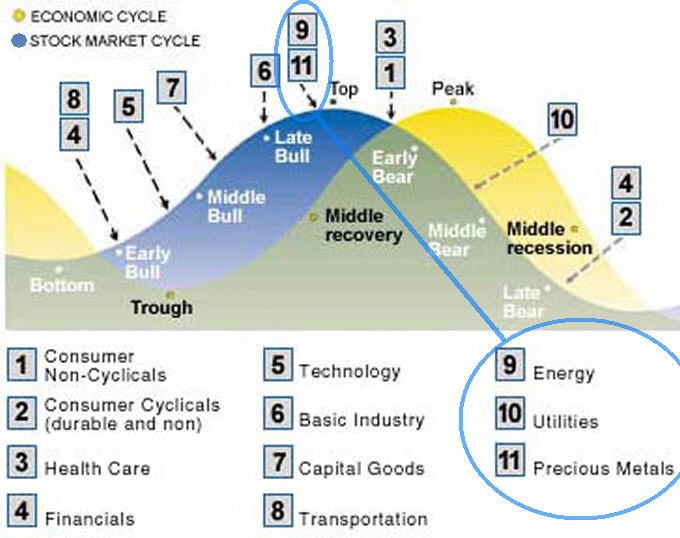
Economic & Stock Market Cycles:
The chart below, courtesy of Donald W. Dony, shows how the market moves in terms of sectors and commodities.
Focus on the stock market cycle (blue cycle) and numbers 9, 10, and 11. In the recent sell off we have seen money move towards the safer investments. Utilities have held up very well along with the price of gold. Typically commodities perform well in the late stages of a bull market which is where the market seems to be.
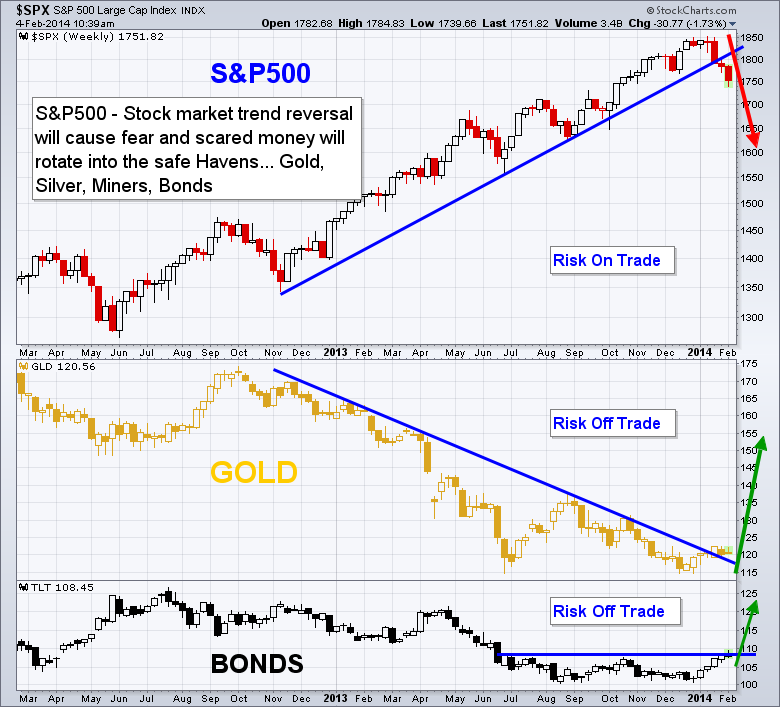
Is February a Risk-On or Risk-Off Trade?
Compare the stock market, gold and the price of bonds. Each of these looks like it will change its trend soon.
While trend lines are a great tool for identifying a weakening trend and reversals in the market, I do not put a lot of weight on them.
Most of my timing and trading is based around what I call INNER-Market Analysis (Market Stages, Cycles, Momentum and Sentiment). Using these data we can diagnose the overall health of the market. Knowing the strength of the market we can then forecast short term trend reversals before they happen with a high degree of accuracy.
In this report I keep things clean and simple using just trend lines. During the last three weeks we have seen the price of stocks pullback. And because 2013 was such a strong year for stocks most participants are expecting a sharp market correction to take place anytime now.
Fear is starting to enter the market and money is rotating out of stocks and into the Risk-Off assets like gold and bonds.
Stocks tend to fall in times of economic uncertainty or fear. Uncertainty pushes investors towards the safety trades (Risk-Off) high quality bonds and precious metals. As more money goes from risk-on to risk-off, stocks will fall and the safety trades will rise. This results in Risk-On plays moving in opposite directions to Risk-Off trades.
The chart below shows what’s unfolding…
INNER-INVESTOR MONTHLY CONCLUSION:
The most valuable information this newsletter provides is the current stock market trend and its trend change alerts.
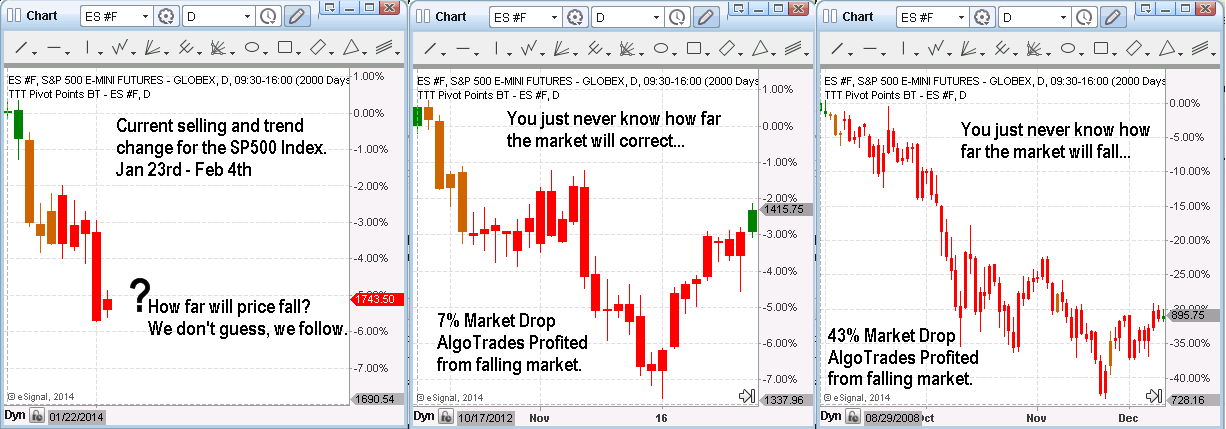
During the last two weeks we have seen stock prices fall fast and hard. The question everyone wants to know is when will stocks rally again or is this is the start of something much larger.
The truth is no one really knows, and all we can do is follow the market.
All pullbacks and down trends start the same way so it is best to protect your capital and move to cash once a new trend is born (Green bars or Red Bars). Wait for a new trade setup with the new trend.
The charts below show the current pullback. Also there are two other charts showing previous trend changes, each with a drastically different outcome. While the second trend change only showed a 7% correction, the third shows a 43% drop. This shows why you need to protect your money and trade with the trend.
It’s better to watch the market rally without you,
than it is to watch your money vanish in front of you.
So with this new down trend in place, I am sitting in cash waiting for a new trade setup to either short the market to make money as price falls, or wait for a new uptrend and a new long entry signal. Cash is a position and having to pay for trading commissions to move in and out of the market is chump change compared what can be lost in one day fighting the trend.
No matter what your investment experience is our how much capital you have to invest, AlgoTrades is here to help. We love hearing from you so send us an email with your feedback. Also, feel free to share this newsletter with friends, family and on your social network!
Sincerely,
Chris Vermeulen
Founder of AlgoTrades.net
Algorithmic Trading Strategies For The Smart Investor